Data Integration with Mike Blakeman, Matt Hand and Catherine Wicklund
Across several industries, there is disparate data running throughout organizations in multiple silos that need integration. In this episode, we pick the brains of Mike Blakeman, the CEO of Visual Globe, Matt Hand, the Vice President in charge of Business Development for Visual Globe, and Catherine Wicklund, a CEO and the Chair of Vistage for Southern Colorado. They talk about how companies can leverage and reduce operational cost with physical asset management by fusing unstructured information that churns out actual intelligence. They also discuss how this integration aids executives to make critical decisions.
—
Watch the episode:
Listen to the podcast:
Data Integration with Mike Blakeman, Matt Hand and Catherine Wicklund
We’re extremely fortunate. We have a panel going on. We have Catherine Wicklund. She is a current CEO and the Chair of Vistage for Southern Colorado. We have Mike Blakeman. He’s the CEO of Visual Globe. We have Matt Hand. He’s in-charge of business development for Visual Globe. Thank you so much for being on the show. Tell us a little bit about Visual Globe, what it does and who it serves.
Visual Globe is a software platform being developed for the physical asset management marketplace. We have a data fusion engine that connects disparate data from all data sources within a company. We understand the need to integrate data and connect to a physical asset resulting in predictive analytics and having the most current data available.
I’m the business owner and going like, “Let me dig in.” Let’s say I am an oil company CEO. How do your software and application help me as a CEO of an oil company?
We’ve conductive extensive research in the of the marketplace, especially in the energy industry. We have found the disparate data problems exist. We know that there’s data throughout the organization in multiple silos, whether it’s in facilities, GIS, CAD, financials, ERP, MRO or whatever it may be. These are business processes that they’re using. Regardless of what type, there are processes being used. Once this data is brought together, which we have the engine to do that, it’s a data fusion engine that brings all this information together. Whether it’s unstructured, which means a PDF, Excel spreadsheet or it could mean IoT sensors in the field coming together into our data fusion. Structured data on the other side is the more SAP, Oracle-type of databases and tables that exist within the organization that’s relative to relative to these physical assets.
In thinking about the solutions in search of a problem, for you, what got you going down this path and deciding to start creating this company to solve these problems?
Over the last few years, I’ve experienced a lot of needs and problems in digital information. All this information is being transformed over time and because of time and technology needs, there was a need to go into the direction of bringing data together. Bringing the data together is going to solve a lot of problems based on the needs of our customers. It could be anything from maintenance and inspection to government compliance. There’s a whole host of challenges that the companies are facing, but bringing the data together for the very first time allows us to create predictive analytics, decision-making, allows them to make better decisions than they’ve ever made before immediately.
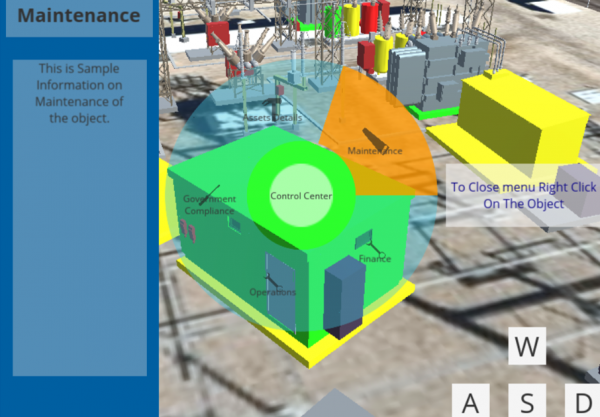
The visualization that they see with the dashboarding and the KPIs that we can do with the data through the data fusion model allows senior-level employees or even managers of operations or projects to be able to see and visualize what’s happening in real-time. By taking the collected data that you have from a physical inventory standpoint and collecting all the data for maintenance records or collecting the data because you have responsibilities for contracts to the people that are actually using the piece of equipment or assets in the field. To bring all that data from a collected standpoint doesn’t show you the value that you need from many different departments such as engineering, operations, maintenance and construction. By showing them the visual model and giving them that visual representation, you’re breaking down those walls and those silos and giving them something that they can all have a communication methodology to use. It’s one visualization of one asset. They all share interests, but they all use that data in different ways. Bridging the gap by bringing that together, solidifies and provides a solution for that problem.
We were talking about a piece of equipment that went on a walkabout. Maybe that would be a reasonably good illustration of a problem.
“Bringing the data together is going to solve a lot of problems and address the needs of customers.”
We focus on the most expensive assets in the field, whether it’s a transformer for $500 million or a compressor that’s $5 million to $10 million in the field. When a large oil and gas company out of Oklahoma City says, “I had a compressor moved from Texas back to Oklahoma City,” a year later, nobody even knew it was moved. This is the kind of problems they’re faced with. What we like to think of first is ask any CEO, CFO, operations facilities, show me where all your assets are and the answer is, “I can’t do it.” We’re saying, “Yes, you can. Not only can we show you how but we’re going to tell you everything about that asset.”
It’s just like your phone. Your phone has all the information at your fingertips, everything about you, all your friends, all your photographs, all your videos. Why can’t you have that access to a large corporation to a large customer who looking at their physical assets? Mostly physical assets are the area where we’re worried about a risk of life. We’re worried about the operations shutting down because of lack of maintenance. When the ball-bearings need to be replaced and they were not, when the assets moved 1,000 miles and you don’t know it, these are problems that we can solve because of the integration and bridging of data.
It sounds like a large intelligence operation between data gathering and indicators to me. You’ve had a couple of people that you’ve talked about that have been in this industry for a while where they have disparate pieces of equipment. They’re a real fan of what you guys are doing. What are the kinds of comments that you’re hearing from the people that know the solutions that you guys are bringing to market?
We’ve had a lot of positive feedback regarding bridging the silos where they had individual operations or plans about a specific asset. They would follow one channel in one organization when they would have a redundant process or redundant data in another silo doing the same thing with that data. By bridging the gap and moving those two together, you’re showing vulnerabilities and visibility to where they have gaps in their processes. That has been key in the feedback that we’ve gotten so far is, “I have a need for this,” because you’re taking down the walls between the organizations by showing the data and where it’s redundant in one effort where somebody else is doing on the other side.
Do you think these companies are even aware of the gaps?
I was going to answer the question of what kind of response we get. For example with one utility company, looking at their data within 30 seconds, they said that data is wrong because they have never seen it together. They’re saying, “Where have you been in the last six years? We’ve been looking for this.”
I think about what you said, “That data is wrong,” and you go, “That data was measured by somebody else. That data was not intel. That data was not useful.” You shake your head and go, “Somebody was busy collecting, creating and curating the data.” It’s a waste of time. I think about the business owner, whether it’s the large utility or whether it’s a big real estate company. It has HVAC all over the place, the ability to curate, understand and bring all these pieces together. That’s what you guys are talking about and that visualization factor. We were looking at your software and you were looking at a 3D rendering from a CAD drawing of the physical plant. You literally could go from here to another location. You go, “What about that thing over there, could you pull the maintenance record on that?” I think for the property managers and others, I bet the insights for the people that saw that were rather remarkable.
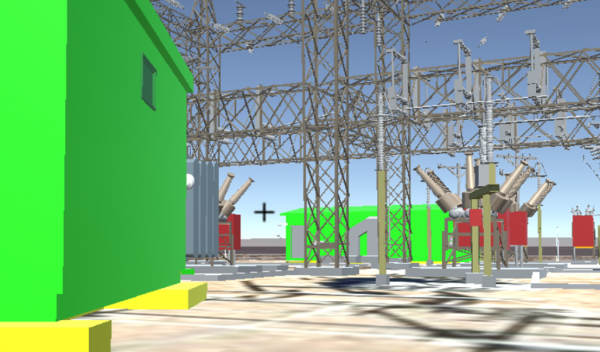
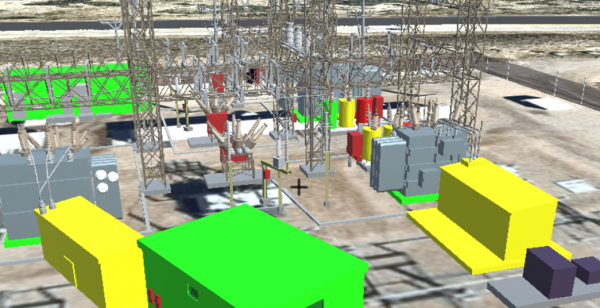
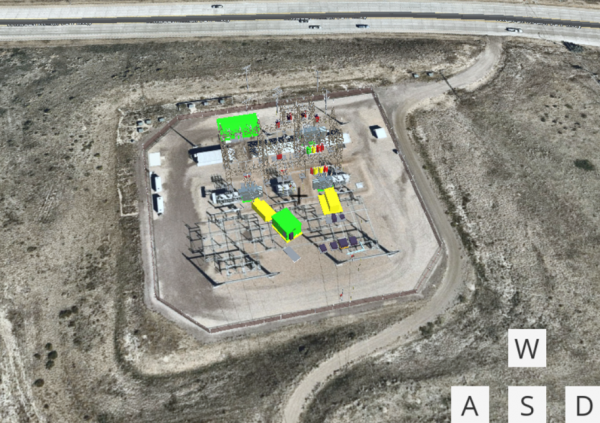
What you are referring to is a 3D visualization of your physical assets on Earth where it belongs. We have the ability to take each of those assets and convert it into a hot, intelligent object. It can turn colors. It can alert you with different scorecards or dashboards based upon the needs of that particular asset. I showed you, Bob, that there’s a green, yellow and red for example. Green, I’m going to ignore. Yellow, I might start looking at it and red, I’m going to take action. It’s all about taking all this raw data and converting it to actionable intelligence. It’s the ability to make decisions as you’ve never made before, thus providing you with a permanent reduction in your operating costs, not just temporarily.
Tying into other processes, applications and platforms that you have as well is a critical piece of what we have done. When you look at the 3D model or the immersive technology that we’re using, where you can look and physically go in a location where your asset resides, you can also tie that asset to a work order, work management system and finance, the things that you care about from that particular asset and all of those channels. We can do it to other applications engineering with the different products that we’ve talked about, SAP and Oracle. That’s another key part of what we’re developing. It’s making it a transactional in the way that it operates so that you can manage and maintain all aspects of your business in regards to that asset.
The ideal clients so far are anybody that has massive plant equipment, obviously the energy space, whether it’s utilities or oil companies, real estate companies with vast and extensive geographically spread. Catherine, were we talking about schools and colleges as well?
Yeah, universities.
Anybody with facilities, whether it’s higher education, medical campuses or even government military bases.
For some of the business owners that may be going, “Isn’t this out there already?” What’s been done so far. Is it the siloed work predominantly?
When you look at the different technologies that we’re bringing together for the very first time, you’re going to see pieces of that being approached by other companies. Big data is here. There are large corporations focusing on big data. You’re going to see the visualization and you’re going to see artificial intelligence. When you bring it all together, you’re solving something that they can’t solve on their own, which gives us a differentiator in the marketplace. We know the time is there. The market told us, the research has told us and the customers gave us pages of documents saying, “Here are my internal problems. Solve them for me.” It’s going to be done through our solution. When we solve those problems, it’s all about, “Why are we doing this?”
It’s not just because new technology is great to have and wonderful. It isn’t happening. What’s happening is I’m taking this and making decisions to save time and money in my company immediately. We can tell you day one when you see the data come together, you’re going to be making the decision to save money and we want that to be a permanent reduction. We want that to be long-term and we want them to be able to say, “I’m going to need more data.” What that means is that they’re going to say, “I need more IoT sensors in the field. I need to be able to monitor that real-time.” It’s on, off, hot or cold. What’s the RPMs? What’s the temperature?”
What’s the maintenance log? What’s my usage rate? Do I have a backlog? Do I have too many on hand? Do I have too few on hand? Did the one break in Oklahoma and didn’t break in Texas? Do I have one in Texas and I need it in Oklahoma?
We welcome data sources, whether it’s IoT or maintenance reports. When it comes to IoT, that is the future of about any major business when it comes to operations. It’s being able to see real-time information coming in, but that’s just one source. It has a relationship to other things and that’s what we want to do is show the relationship.
I think about the difference between data and intelligence. What you are taking is the various siloed data pieces and try to interrelate the data where you create actual intelligence so you can either take and make a quality decision, make, save or spend money on that for the business owner.
The attributes are very important about the asset as well. It is working hand in hand with a client or customer to identify what attributes they care about. What is it that’s important to you might be different than what’s important to Mike. Those are the things that we’re also trying to tie together, so we have a unified message of what do you want in return and how do you want it. I think that’s important with the visualization pieces one, but tying it back into their legacy systems is another.
It sounds fabulous. It’s a way to keep track, create intel, execute quality decisions, identify gaps and provide effective solutions. For you, looking at your years of experience, if you could go back with what you know and offer advice to your 25-year-old self, Mike, what would you say to your 25-year-old self, knowing what you know now?
Ask a thousand questions and listen to the answers; that’s how you learn.
There are several things I would say. The first company that I founded and sold was an experience of how to run a company not knowing what needs to be done, how to manage all the assets as you grow all the facilities and the processes. At that time, I decided to join Vistage with my first company, which is the best decision I’ve ever made. The reason for that is because I’m sitting in a room with members who are running $50 million to $100 million companies who are offering advice to me. They are hiring people left and right growing as quickly as I could handle it. That was a great response to the need I had then and I offer to other people. The other thing that’s important is that when I speak at higher education university to the entrepreneurship class. Every time, there’s always one question, “How did you get started and why?” The answer is, “I asked 1,000 questions, I got 1,000 answers and I listened to them.”
For the people that don’t know what Vistage is, we’re fortunate that we have an expert here. What is Vistage?
Vistage is a worldwide global membership organization. We have about 23,000 members globally. It’s a pure advisory group opportunity for business owners, CEOs, presidents and partners to come together once a month and have the benefit of a professional development speaker, either personal or business development speaker as well as some wise people sitting around the table to help you problem solve and troubleshoot some of the challenges that you see as CEO.
I had not heard of Vistage and I had no idea and you’d hear, “I’m in Vistage.” I go, “Good for you.” You’ve done it more than once in your business career coming back to Vistage. If you were to look at yourself when you first went to Vistage and that you’re back in with the business that you’re in, what’s the difference between the two journeys with Vistage?
It’s simple: technology’s changed. The culture, a new way of thinking, social media, many things have changed since then. It’s time to listen to how you run a company differently than you did as opposed to how culture is such an important part of a company. It’s how you capitalize on social media because that’s what’s becoming the wave of the future or it’s already here that allows you to rate, move, see, learn and be able to share your business value.
It’s an interesting opportunity. Matt, what advice looking back given what you know would you offer to your younger self?
It’s to focus and listen to different advisors about what they need and not what they want. I think it’s important to differentiate the two. I think a lot of things that people want could be material items in businesses and they say, “That looks good, so I’m going to go ahead and purchase that. I know some other people that have purchased a big name. I should go in that direction.” Does it solve the need for your company? Does it solve the need to be able to be successful with whatever you’re doing? I think my advice to myself would be to listen, understand the need and capitalize on that.
For the company, if you can put an ad on page one of the local business paper sharing your message or advice, what would it be?
We are changing the way a company manages its assets by using new technology unlike before.
If people have that equipment and they’re in search of the solution, they should call you.
That is true. They can go to the website.
How do people find you?
Through our website, Visual-Globe.com. It’s Mike Blakeman on LinkedIn. We’re setting up a Twitter account.
Mike, what is the best allocation of your time or initiative that’s helped your company and why?
The allocation of time would best be represented by being in the industry listening to customers tell us what we need and what they need and how to improve their processes. The other part of my time would be having guys like Matt join and become a partner in the company, which changes the dynamics of the company.
Surround yourself by people that have experiences in what you’re trying to develop. The three of us, we all bring something to the table, whether that’s our previous work history experiences in the industries, knowledge of our client base, doing the research and developments. It’s necessary to see who our competitors are. What do they bring to the table and where the best practices that we can capitalize on? Through conversation, we’ve been able to develop a clear focus point and a strategy of how we want to go forward and how we believe we’re going to be successful. You capitalize on it again and I’ll go back to a previous statement, which is what I told my 25-year-old self, which is listening to the need. I think that’s our message to our client base. That’s what they’ve responded to. We have a questionnaire that we send out and they answer the questions based on their needs, not their wants.
If you were to characterize the top one or two problems or needs that your ideal client would have, what do you think the two most prevailing or predominant issues or problems that your company is going to solve for them?
I think that maintenance and inspection is probably the highest level of need on physical assets. Are they being maintained properly? Are they being maintained according to the manufacturer specs? For example, we can take your catalog on your particular asset, they’re sitting in paper form and we can convert that and link that to the website of the manufacturer so you can actually see what’s required. They’ll throw away all those catalogs and manufacturing specs that are on the shelf, but it’s all about that ability to look at your maintenance, look at inspection and the be able to correlate it with other things, financials and facilities. I think that’s the most important because when things shut down people, aren’t happy and we want them to be happy.
That’s usually fairly expensive.
I’m looking at it from a cost perspective. If it’s a work stoppage, it costs the company money. You want to avoid that at every cost if you can by looking at the current data and figuring out what’s next.
Someone might say, “I already have an inspection and maintenance procedure.” We welcome that but to correlate it with other data, it changes the game.
If a former military says, “Have you pulled maintenance?” You go, “Yes.” They say, “What does it look like?” You go, “I pulled the maintenance.” He goes, “That’s interesting. The specs changed based on our experience. Our preventative maintenance would suggest that 80% of the standard is better and it preserves our equipment better. We’re at 120% of the time. Where’s our spare one?” Because one’s going to go based on our experience and the geographic wear and tear on whatever you have. For me when I think about maintenance and proactive maintenance saving me money and making sure
One other thing I’d like to add with the maintenance is that the technology that we’re talking about has changed as well. When you have a physical asset, there may have been technological advances to change the inner materials of that particular item. It’s looking at it from a maintenance record of, “What was the wear like?” If I take an industrial pump, for example, the polymers or the things that they use in the internals, the elastomers, could they be using a different product to be able to maximize the efficiency of that particular unit? Can they extend the life of that unit by using something else? That’s going to bring to the table the visibility to what has it look like in the previous record? Most of the times when people pull maintenance records like they’re pulling the last file one. If you can look at the last ten years and start doing some analysis on that, bridging that data gap is very extensive when you’re doing it manually, but through a digital world and giving them that view on a dashboard, it eliminates all that labor and the effort.
Can you do a predictive forecast then based on the last ten years, “This is what you should expect going forward,” and then preventative?
We do predictive and preventative based on client inputs. We would have to work with them and understand what it is and what they’re trying to do. If you look at caustic materials, in the example I gave, that’s going to show wear and tear. We could do some good analysis on that particular model to provide that analysis back to the client. Other industries do a lot of the same thing. What am I doing? What am I using? How am I treating any particular asset? Using the data to provide a background to that is going to bridge that gap of communication and allow people to come together and say, “John down the road here has that expertise in his head rather than on paper.” He brings that value as he’s seeing what we’re talking about on a screen or even in the 3D modeling world.
It’s not just predictive and preventative from an asset perspective, but also from a teamwork perspective. You’re able to identify what problems the gaps in communication or the right hand not talking to the left hand have caused the company pain points and how much it’s cost them.
Mike brought the example of the people looking at the data says, “My data is wrong.” Is your data wrong or how do you input the data? What artifacts are you using to provide the data, which is wrong?
It sounds like the compass is wrong. That usually doesn’t work out well. We’ve had a fair quantity of climate events. Let’s say you have a broadly diversified set of equipment across the United States. Some of it’s working in what we consider normal climate conditions for that piece of equipment and you have one that’s heavily rained on. You have one that’s heavily impacted by cold and you can start looking at the anomalies of weather on your maintenance records and start getting predictive on what you do. I think about the value of that particular thought process, there’s a big windstorm and based on history and based on these factors, we need to pull maintenance on that faster. It’s not just the old guy that’s on the site that understands that.
Bringing in weather is just another data source. If you’re taking that humidity, it’s different between the north and the south in the United States and that has an impact on the asset. There are other data sources that could be brought in to how to predict the longevity of any asset.
It needed preventative maintenance.
I had this blinking light screen in front of me of, “That’s good and that’s bad. That one needs some help.” You can do a heads-up work and go, “We need to reach out to that area to get that sorted out.” On one screen and the ability to drill down on the screen to check the oil, for a lack of a better term.
What piece of advice can you share with us that you think most contributed to your success so far?
It’s the understanding because I’ve been so involved with the industries that we’re talking about. It’s being familiar with the asset information, the 3D models, mapping information. All of those things came into play in terms of the pretty obvious choice in terms of technology. We are bridging some gaps that have never been bridged before. The technology, when we talk about data fusion makes the changes everything they do. We talk about the fact that if you don’t bring your data together and fuse it, you’re going to be faced with some challenges. You’re not going to be competitive. You’re not going to be able to reduce your operational costs. That makes you less competitive in the marketplace. It raises your cost and continues to raise those costs because you’re working under the old traditional methods of running a business. The time has change where technology is here to stay and it’s going to make a difference in how you operate.
One of the questions I haven’t asked you, Mike, that goes along with what we were talking about as far as physical assets in universities and medical campuses, is what about ships on the ocean? What about cargo? Is that applicable or not?
You have to think that every single asset, no matter if it’s fixed or mobile has associated data sitting somewhere in the organization. It doesn’t matter to us. We don’t care about the shape of the asset. It doesn’t matter.
We typically think land but it’s not a restriction.
It has no restriction at all. That fixed asset seems to move.
Let’s say that it’s a two or three-factor event that causes a piece of equipment to fail and the ability to machine learn if you didn’t know the relationship to start with. As you are able to aggregate and basically cross-pollinate data that you can machine learn from the various silos and start to take in and make a difference.
I think that is one of our focal points is understanding what data streams impact that asset. What makes it run and what are the outputs of that asset? Understanding that piece of it is the discovery portion that we do on the frontend with our client to say, “I understand what you use this or what else is it doing? Where else is it communicating? Does it have a function where it has a reporting mechanism as reporting back to a system that you don’t know about from the operations perspective?” The key to the predictability and machine learning is understanding the purpose of the asset. That’s a lot of client interaction so that’s a lot of where we spend the upfront time and then taking that information back into internally for us to be able to put together a model for the machine learning in the future.
What are the outputs and how are we going to show that to you? Visibility is important. It could be more than just looking at statistical analysis, looking at past records and showing more a future outlook of what that particular item is going to look like and why it’s necessary for your infrastructure. It could be eliminated through what we’re trying to do because you have another product that could replace it. Looking at the financial analysis as it’s related to that asset is very critical as well.
More intel and quality decisions, that’s what you are after. For the business owner, you don’t need to create any more data than you currently have necessarily. To start with, you have the data siloed and if you go to that process and you go, “There is a disparate piece of data that I don’t have that would drive your gap to gather data.”
Bring the data together first and decide what you do next. Bring it all together and say, “We brought in the legacy data from the last 30, 40, 50 years.” We’re still using Excel spreadsheets, which is fine. We’ve added a sensor to out in the field. We may be using a strong business process, expensive Oracles and the SAP’s out there. That’s great. It’s a good choice. The point is once you bring it all together, then you’re going to realize that the data coming in is only as good as the data that exists. We cannot change the transpose of numbers, the naming of an asset in seven different ways. We can’t change the inputs that were erroneous from the beginning.
We all learn differently, but one commonality we have is visual.
That anomaly usually bounces and sticks out. You go, “They transposed a number over time,” because I think you can normalize that and look at what’s normal.
You can bring it together and begin to start to build normalcy in the data.
You can think about it and ask: “Does that make sense?” based on whatever you’re doing. What I liked so much about what you’re talking about doing is I’m a fan of predictive behavior. Looking at what you’re trying to do and you, it gives me a basis to have some level of confidence in what I’m anticipating. What if you have a load factor and one part of your system goes down, you have to build up the load on another location to cover for the one that’s down? What does it do?
I think it’s important what you said, the level of confidence. How do we build it?
It’s budgeting, confidence and maintenance. We’re here. Do we need to do that? Things are slowing down. Do we need to do it? Did we know it’s slowing down? I think all of those things are capital expenditures for what you’re doing as a business owner. Spend it when you need to.
One of the clients that we talked to had talked about an inventory and inspection program that they did annually. They collected data, came back, which is repetitive. It’s an expense that they’re paying out. If they were to take that, consolidate the data, get the data sets that we have, put it through the data fusion model, which could show them quickly where you have gaps to streamline their inventory process. Instead of it being a whole inventory process every year in inspection, they would do a smaller percentage saving them a ton of money each year on just one particular change in their existing process. That’s through the visibility of the data and seeing it in front of them. Where do I have gaps?
I think it’s also important to note in our data fusion model, we have security built in the frontend and the backend. It is such an important part. This data that we’re talking about fusing is not meant for the public and never will be. It’s designed for their own internal use. It’s a critical point when it comes to understanding that you can fuse your data but we’ve addressed those security issues. It’s a very important part of this.
It’s not getting better every day, the need for security on data. That is extremely important for the company and they’ve already got exposure to the data they have. What advice might you offer to a new CEO that’s taken on the job as CEO for the first time? What might you tell them and why?
I would tell any entrepreneur, and I’ve told them before, “You have to understand the rules of the game.” Entrepreneurship has its own rules. It’s not what everybody thinks. If you think you have all the flexibility and time in the world, you don’t. I also say it’s not about you can go to the dentist anytime you want. I think it’s about understanding the rules of not having a security net below. Know the risks that are involved and know the commitment you got to have and going forward. It’s so important that if you don’t understand those rules, then you can’t make it in the business world. Without experience, it’s important to know those types of rules beforehand or most people would say, “That’s inherent. That’s who I am. I grew up knowing that I will have my own business from the age of ten. It’s always been part of the business.” I try to explain some of the examples of why the commitment you’ve got to make and that I think is critical.
In many cases, I’ll be told, “You should have good financials,” and you go, “Thank you for that.” For the business owner, entrepreneur, they’re in business because they had a passion but they never knew the rules. You’re going, “Where do I go get those?” Obviously, one is Catherine with Vistage. That’s a good place to get rules. Where else might they go as a resource to get some of the things that you’re talking about if they feel like they’re short of that knowledge?
There are plenty of YouTube videos out there explaining the dos and don’ts of running a business and knowing the different components of the business. You’ve got to understand that there are some people who go into it saying, “I’m an engineer of operations. I have no interest in sales and market.” You’ve got to understand that there are three legs to every business and you’ve got to balance those three legs or that stool falls over. You’ve got to understand all three together to make it happen.
To your three legs defined by you, what would they be?
Operations, business development, and finance.
Looking back, you and I have been on this journey together. You started Visual Globe how many years ago?
It started three years ago, getting involved in creating intelligent 3D models.
What motivated you to start this and then what keeps you motivated?
Being involved in a software platform solution like this is highly motivating and most importantly, it’s a lot of fun. Everybody can have fun in the process. The reason I can say we gain that fun in the process is because of the software platform, we’re going to make it so the user experience is going to have a fun experience when they’re managing their assets. I think that’s a whole new mindset to the operational world and I think we’re bringing that piece to it, which makes it fun.
You’re motivated because this is creating a solution for companies and organizations that they don’t have and because you could make it fun to create positive change.
It’s fun and another word for it is passion. Most people say it is fun!
What keeps you motivated every day? You’ve got to get up and slog. It’s a business. You’re the entrepreneur.
It is our progress. The customers are now coming forward talking to us. It’s fulfilling the solution, seeing them react to it, respond to it. That’s a major motivation, but it’s also about building something. It’s having other people be involved, hiring more people to fulfill different staffing and need requirements. The first company, I saw them start out in one position and move to the next, and I’m thinking that having someone to work and grow within the company, being promoted was exciting. I loved to watch their excitement and say, “You believed in me that I can do this job and move up.”
I was thinking, the joy of solving a problem for a client, if you’re doing this just for an exercise, that’s not much fun. If you can go and actually improve the life of your client by the solution you bring, there’s a certain value to solving the problem. If it was a perfect world, we were three years out and we were sitting back down to do this again, where would you see the company three years down the road?
I would see us both a national and international company working with customers all over the world, focused on partners that are supporting and working with us to generate more projects and opportunities. I see it growing in terms of the number of employees, the revenue. We think it’s got substantial revenue growth already looking our way. We’re excited about that and that’s what I expect to see in the next three years.
It’s the diversity of clients as well. There are so many markets out there that this is applicable to because we’re not isolated into one niche. It’s not one asset type. It’s physical assets. You can go to 50 different industries and they would all say, “I have physical assets. How can you help me with those?” We can paint a picture and we can show them the roadmap of what we can do for them. That’s what I’m inspired by and the fact that I think the services that we provide on top of what we do from a 3D modeling, what we show them will help them develop internally and crash the barriers of communication. Obviously, I’m sticking on that a lot and I’ve had that because of my past experiences.
I’ve been into organizations both corporate and independent where you walk into the building and every group is in a different corridor. Everybody operates within their own structures and when you try to bring everybody together, they have a different opinion. Going back to diversification in the market place, understanding different markets, understanding an asset, bridging the gap of communication is the key to me. That’s what drives me on a day-to-day basis. That’s what I’m passionate about and that’s what I believe in what we’re doing because of how we are bringing the visualization to the communication platform.
There’s always the one guy that’s been doing this one particular job for years. He knows that one piece of equipment or that one thing like it’s his kid. He knows it well, “I made this noise, I need to go do this.” The institutional knowledge that resides with that person goes away when they leave the organization. I think about what you guys are effectively doing. You’re institutionalizing wisdom and knowledge from time. It doesn’t replace that particular wisdom of that person, but it preserves it and curates it for the entire company.
As you said, Matt, there are a lot of people just walking around with the knowledge in their head. Nobody’s bothered to extract it or wouldn’t know how. You’re providing an outlet for them to extract that information and data and start measuring it.
Because we all communicate differently. There’s written tactile learning and we learn differently as well. The one commonality between all of that is visual. If you can visualize what you’re doing, you usually can speak to it or maybe somebody can write it down and provide their details. I can see that. That quantifies what we bring to the table and why.
I can’t tell you how much I appreciate you guys taking time out of your busy schedule to come down and talk about your company. We look forward to knowing great things about what you’re doing and the successes you have in the future. Ms. Catherine, thank you so much for taking time out of your day to co-host this with me.
Thank you for having me.
Guys, I wish you much success.
Thank you very much.
Important Links:
- Vistage
- Mike Blakeman – LinkedIn
- https://www.Visual-Globe.com/
About Mike Blakeman
 Visual Globe has transcended the boundaries of siloed data communication and asset visualization by developing a platform that connects ALL organizational domains with a common language….. Visual Transparency. We provide real time views to all facility and physical asset data regardless of source using a fully integrated, intuitive immersive world where you control your environment. We have developed a SaaS platform by integrating a gaming UI/UX experience with 3D mapping visualization, linked to a data fusion engine reporting current, preventive and predictive analytics. The result is the ability to transform your data through one touch Limitless Results.
By bridging the gap of disparate legacy data and modern technology, Visual Globe is solving the paradigm shift that ails big data driven companies. Answering the needs of the business and instant access to information, linked to the most complete set of physical asset attributes regardless of data type, will transform your bottom line, ROI and streamline your process. Data Freedom of your assets and simplicity at your finger tips.
About Matt Hand
 Methodical and motivated technology professional with 16+ years of experience managing complex, highly visible, large scale infrastructure services programs. In depth knowledge of project management methodologies (Six Sigma, AGILE, Waterfall). Directing Enterprise Operations programs with expertise in remote management, onsite process implementation and strategic planning.
In my tenure, i’ve successfully designed and implemented cost saving strategies to reduce expense on projects and generate revenue for the client, often time exceeding forecasted revenue targets. Focused on bridging the communication gaps by creating a unified approach to Asset Management and the power behind consistent messaging and process.
Love the show? Subscribe, rate, review, and share!
Join the Business Leaders Podcast Community today:
- businessleaderspodcast.com
- Business Leaders Facebook
- Business Leaders Twitter
- Business Leader LinkedIn
- Business Leaders YouTube
The post Data Integration with Mike Blakeman, Matt Hand and Catherine Wicklund appeared first on My podcast website.